Are you making the most of Google Analytics? How do you know whether your marketing is working if you don’t track?
Gill Hutchinson explains how to devise your own website ‘Dashboard’ of key performance indicators using analytics. This will allow you to check that your digital marketing is working well and to refine and improve your performance over time.
When we’re working with our clients on digital marketing, we always track their progress in Google Analytics. It’s the simplest, easiest and most widely used free tool for website monitoring.
Make sure whoever builds your website sets up the analytics tracking code onto each page so it can be activated. You can then log into your data anytime. If you had your website built a while ago then don’t worry, it’s easy to get your developer to add the code into your website.
We set up Excel spreadsheets for all of our clients turning their analytics data into graphs. This also enables us to track the client’s return on investment and means that as we try new things we can see what impact they’re having.
It’s important to have a plan, to measure what happens and to monitor it. Then you can review what you’ve achieved and create your next plan with those previous results in mind.
The Business Accelerator and other grant funding can be used to work in improving your marketing strategy, planning, implementation and measurement systems. So if this is something you need to do, then it’s worth talking to the Business Accelerator team.
What can Google Analytics do?
Google Analytics gives you data that can be used to track visitors and also show you how they behave when they’re on your website pages. Do they move around, spending time on lots of different pages, or do they visit one or two pages before leaving?
It’s important to look at trends as well as the absolute data. You should review trends over time. Check at least once a month at first and then once you know the ‘steady state’ situation, this can become a quarterly exercise.There is one exception to this – if you’re using Pay per Click advertising then this should usually be monitored daily.
What should be on your dashboard? You should track the same things we track for our clients, so that’s:
- Quantity – how many visitors?
- Quality – are they ‘good quality’ visits?
- Content – what are your visitors looking at?
Useful things to look at include whether people are looking at your website on a phone or a computer, as this is vital to know when you’re planning your website.
All websites should be mobile friendly now, but if you know that a large proportion of your visitors are on their mobile, then this will encourage you to make your website mobile friendly sooner rather than later.
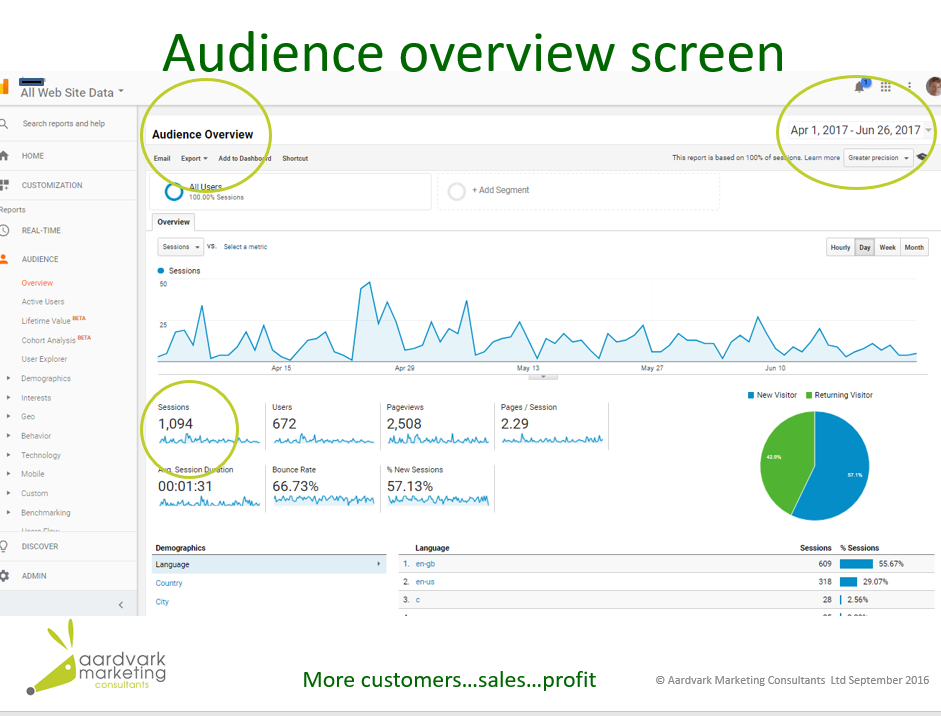
Use the Audience Overview screen and track for the last month. You’ll be able to see the number of users (people who’ve visited your website), the number of pages they viewed and also see average time on your website per visitor, the bounce rate and how many were new visitors or returning visitors.
It’s vital to track this, as you can’t possibly know whether your digital marketing is having an impact unless you monitor it.
To understand this topic in more detail and hear more about the strategies Gill uses Click here to listen to her webinar